Resources
Downloadable Dissertations from the Groups of Wilhelm Simon and Erno Pretsch at ETH Zurich
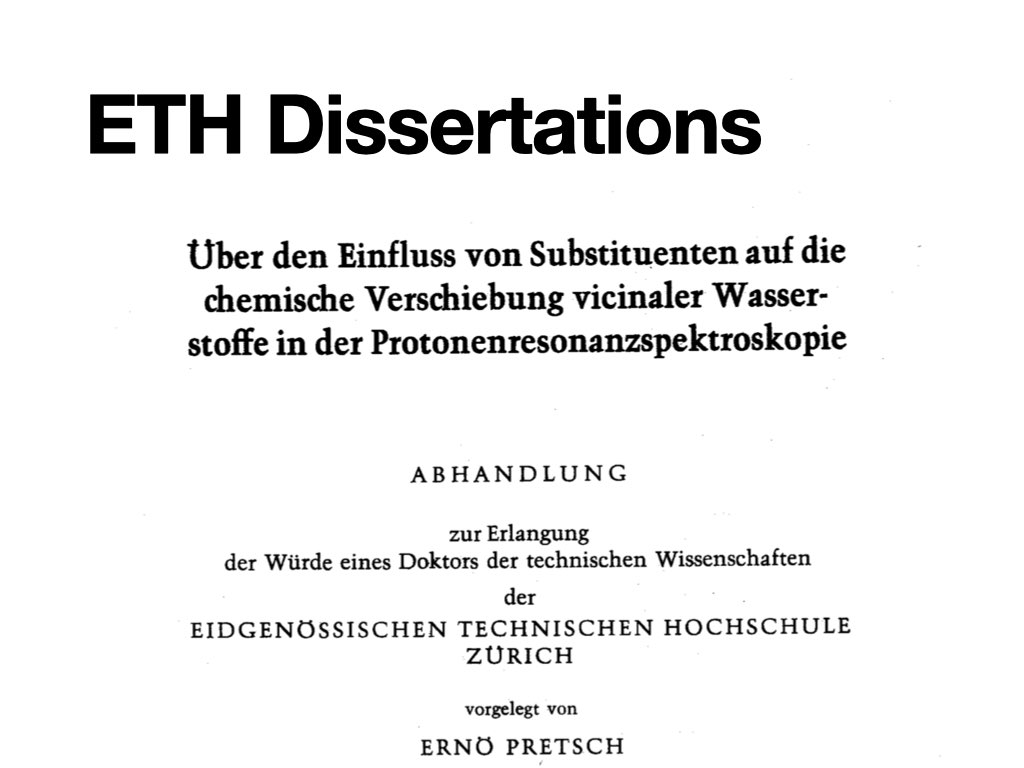
This opens a page with links to all downloadable Doctoral Dissertations from the Groups of Wilhelm Simon and Erno Pretsch at ETH Zurich going back to 1962. Most of the works are written in German language. Note that this is only a fraction of all dissertations from the two groups.
Mathematica Teaching Resources

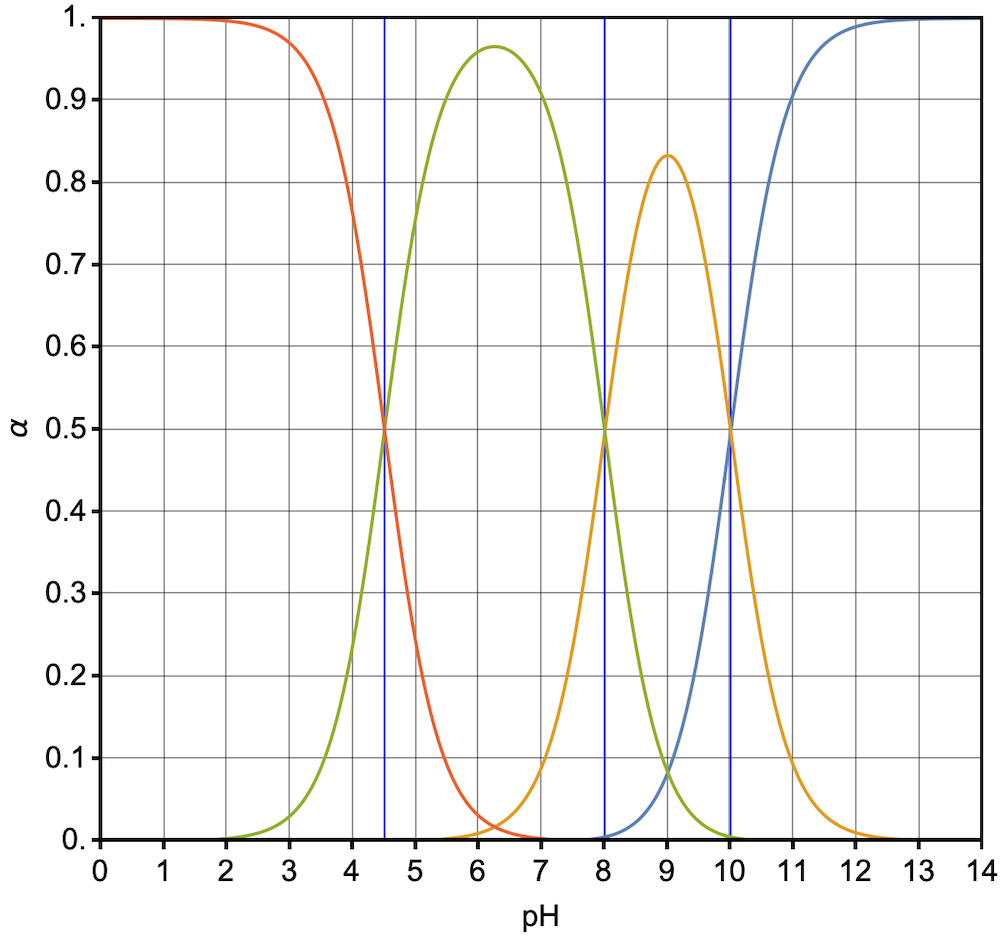
This mathematica file calculates logarithmic species concentration as a function of pH from any number of pKa values and a given total concentration in a Sillén diagram. It also plots the mole fraction of each species as a function of pH in a separate graph. The file requires Wolfram Mathematica to run.
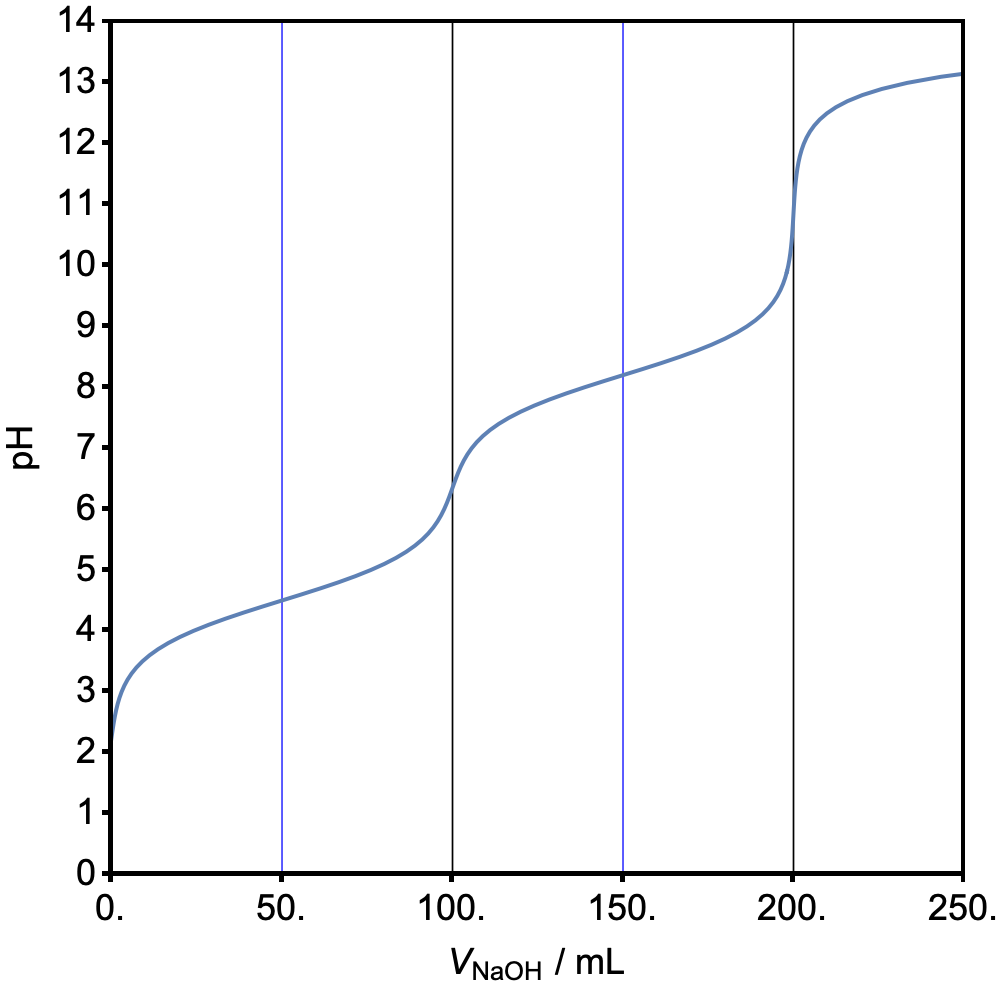
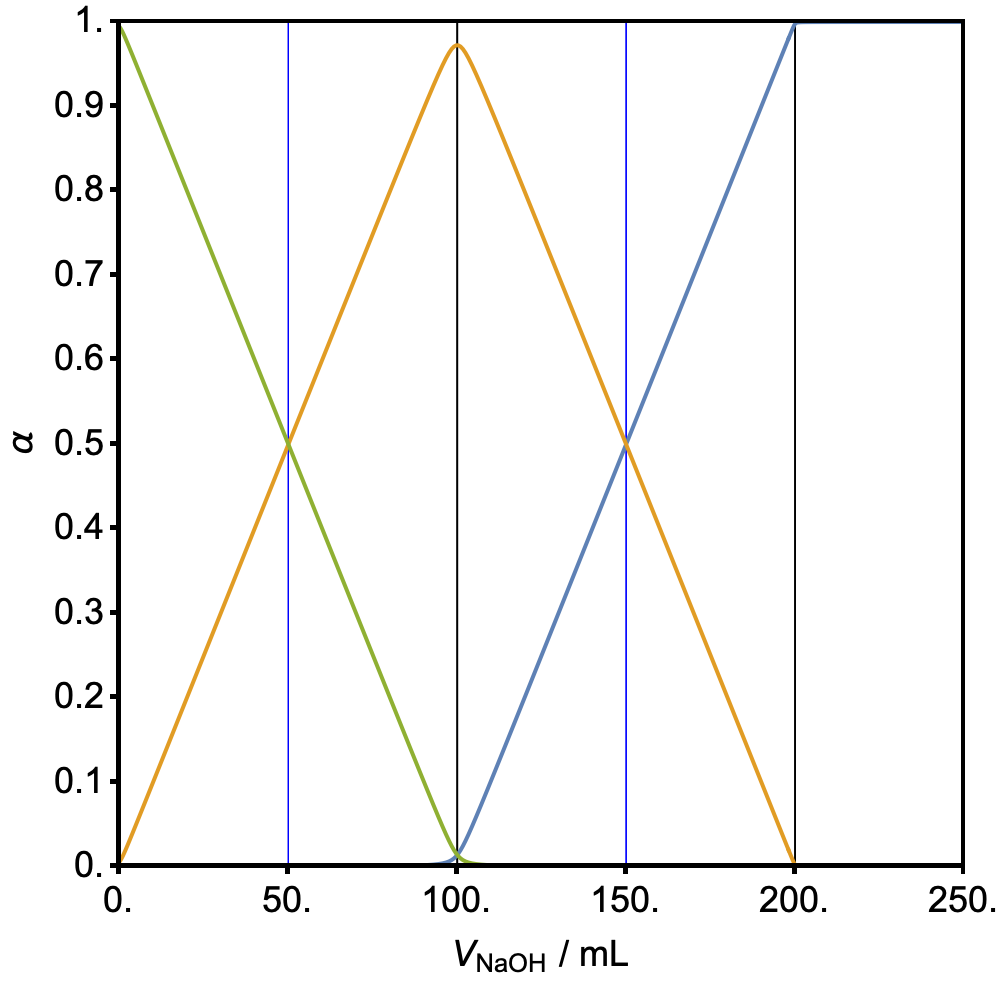
This mathematica file will automatically calculate the titration curve for any mono- or multiprotic acid. The pKa values, initial concentration and volume, and concentration of titrant are used as input. The species concentrations in the course of the titration are given in a second figure. The file requires Wolfram Mathematica to run.
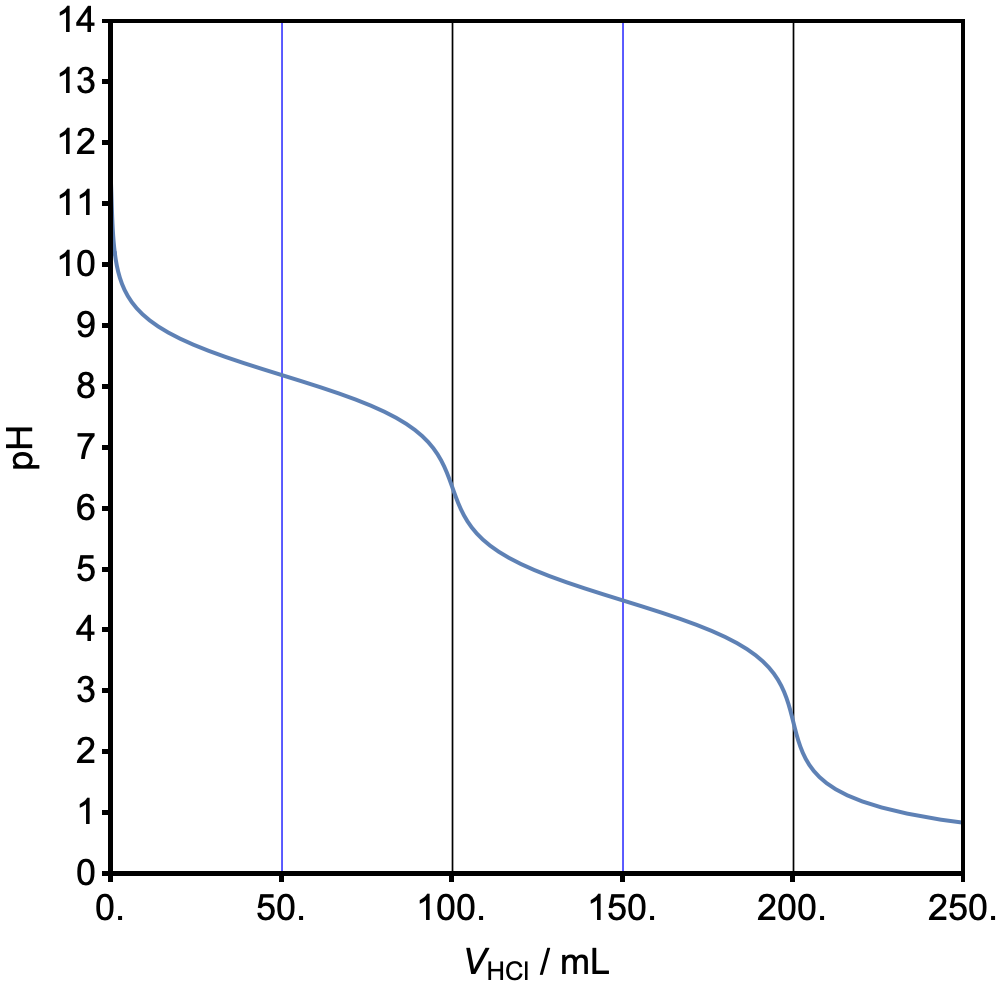
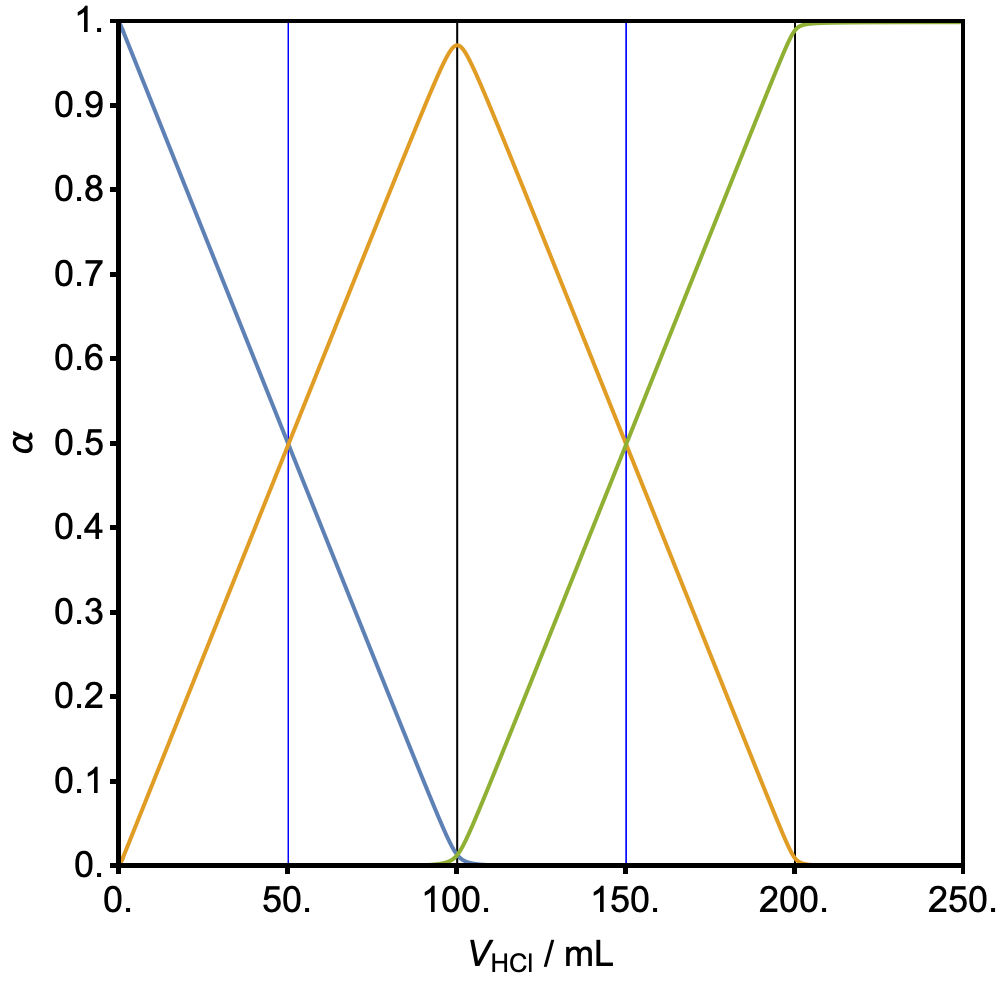
This mathematica file will automatically calculate the titration curve for any mono- or multiprotic base. The pKa values, initial concentration and volume, and concentration of titrant are used as input. The species concentrations in the course of the titration are given in a second figure. The file requires Wolfram Mathematica to run.
Correct and plot a potentiometric calibration curve.
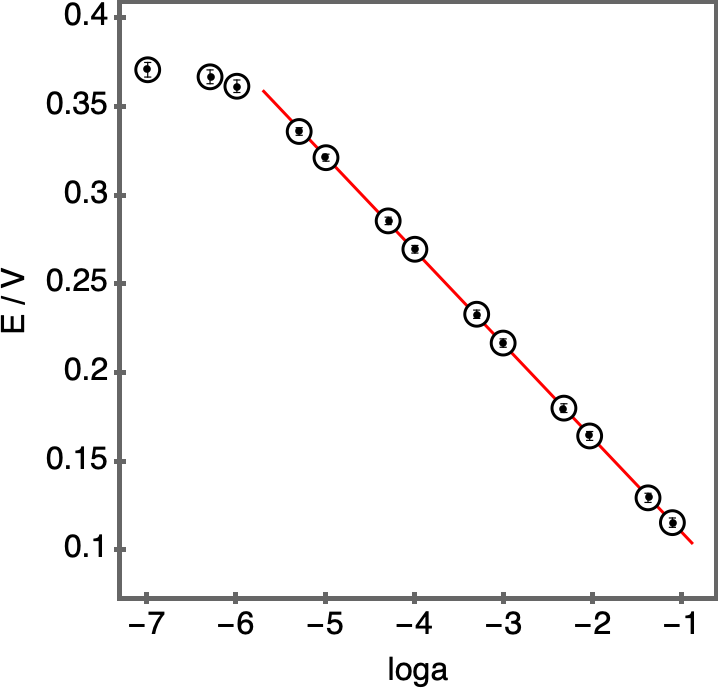
This mathematica file calculates activity coefficients and liquid junction potentials for a potentiometric calibration and plots the resulting calibration curve. The file requires Wolfram Mathematica to run.
Plot mass spectra from a table of data.
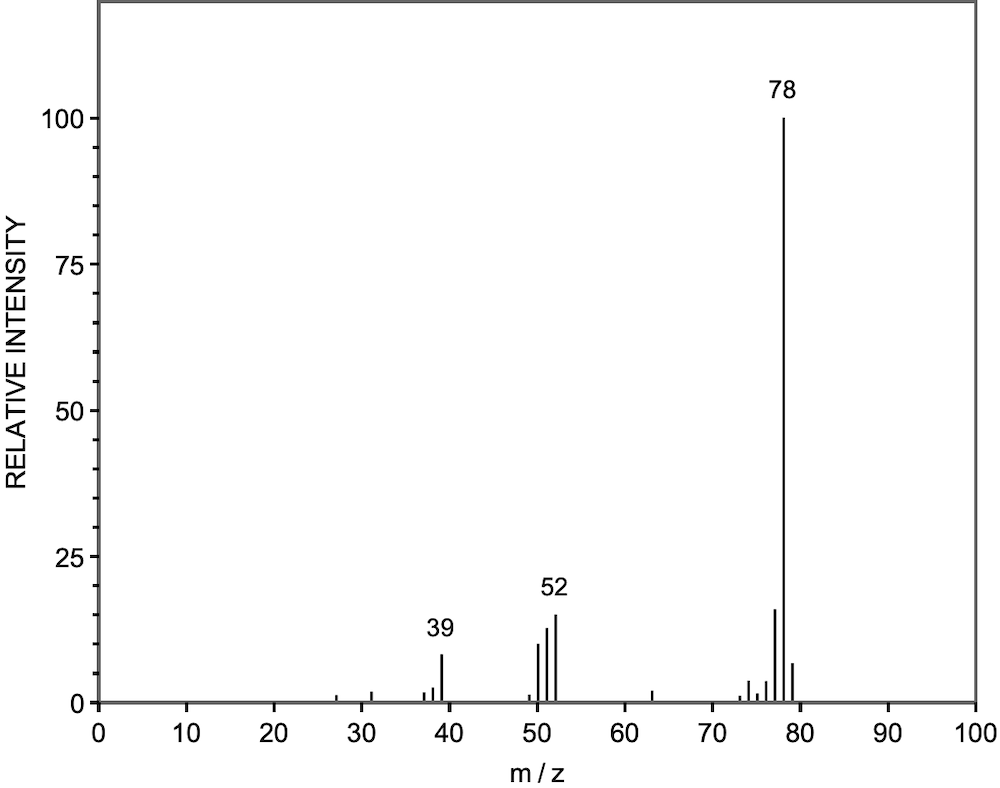
This mathematica file automatically outputs a quality mass spectrum on the basis of a list of values (peak intensity as a function of m/z values) obtained experimentally or from a database. In a typical workflow the data are imported first into a spreadsheet software, copied from there and pasted into mathematica. The default settings can be adjusted if needed to label the peaks appropriately.